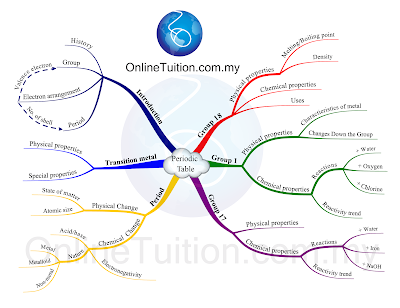
In the world of visual communication, two powerful tools stand out: mind maps and infographics. Both serve the purpose of conveying information visually but are distinct in their design and applications. Let's dive into what makes each unique and explore scenarios where they shine.
Mind Maps: The Organized Chaos
Definition: A mind map is a diagram used to visually organize information. It starts with a central idea and branches out into related subtopics, making it an effective tool for brainstorming and organizing thoughts.Structure:
Central node for the main idea.
Branches representing subtopics.
Sub-branches for additional details.
Use Case 1: Project Planning
Scenario: A project manager needs to outline the key phases, tasks, and deadlines for an upcoming project.
Why Mind Map: The hierarchical structure of a mind map makes it easy to break down complex projects into manageable parts, showing relationships between tasks.
Use Case 2: Learning a New Topic
Scenario: A student wants to grasp the main concepts and subtopics of a new subject.
Why Mind Map: Visualizing the subject matter helps in understanding how different concepts are interconnected, aiding memory retention.
Infographics: The Visual Storyteller
Definition: An infographic is a visual representation of information, data, or knowledge intended to present information quickly and clearly. It combines text, images, and design elements to communicate a message effectively.
Structure:
Visual elements like icons, charts, and images.
Text for context and explanation.
A cohesive design layout.
Use Case 1: Marketing Campaigns
Scenario: A marketing team needs to present the results of a campaign to stakeholders.
Why Infographic: Infographics can showcase data and insights in a visually appealing way, making it easier for stakeholders to understand the impact of the campaign.
Use Case 2: Educational Content
Scenario: An educator wants to explain the water cycle to students.
Why Infographic: Complex processes can be broken down into simple, digestible visuals, making it easier for students to grasp.
Comparing the Tools: Infografix, NoteGPT, and Visme
Infografix
Overview:
Price: Free
Pros: AI-based, simple interface, fast.
Cons: Limited customization and features.
Best For:
Quick, AI-generated infographics without needing extensive design skills.
NoteGPT
Overview:
Price: Free for basic features.
Pros: Powerful AI, versatile, supports various file formats.
Cons: Requires a stable internet connection, limited free version.
Best For:
Creating mind maps and summarizing content from various sources.
Visme
Overview:
Price: Free tier available, with premium plans starting at $15/month.
Pros: Extensive templates, highly customizable, advanced features.
Cons: Can be overwhelming for beginners due to extensive features.
Best For:
Comprehensive design projects that require high customization and advanced features.
Applying the Tools to Scenarios
Project Planning (Mind Map)
Tool: NoteGPT
Why: NoteGPT can generate detailed mind maps, helping break down project tasks and visualize the workflow.
Learning a New Topic (Mind Map)
Tool: Infografix
Why: Infografix can quickly create a structured mind map using AI, making it easier for students to understand and remember complex subjects.
Marketing Campaign (Infographic)
Tool: Visme
Why: Visme’s extensive templates and customization options make it perfect for creating visually appealing infographics that effectively communicate campaign results.
Educational Content (Infographic)
Tool: Visme
Why: Visme’s design elements and templates help in breaking down complex educational content into simple visuals, making learning fun and engaging.
Final Thoughts
Whether you’re looking to brainstorm ideas or present complex data, mind maps and infographics are invaluable tools. By leveraging the right tools like Infografix, NoteGPT, and Visme, you can create compelling visual content that enhances understanding and engagement. Each tool offers unique features and price points, so choose the one that best fits your needs and budget.
Feel free to experiment with these tools and find the perfect balance between mind mapping and infographic creation for your projects!


No comments:
Post a Comment